Caffeine in Coffee

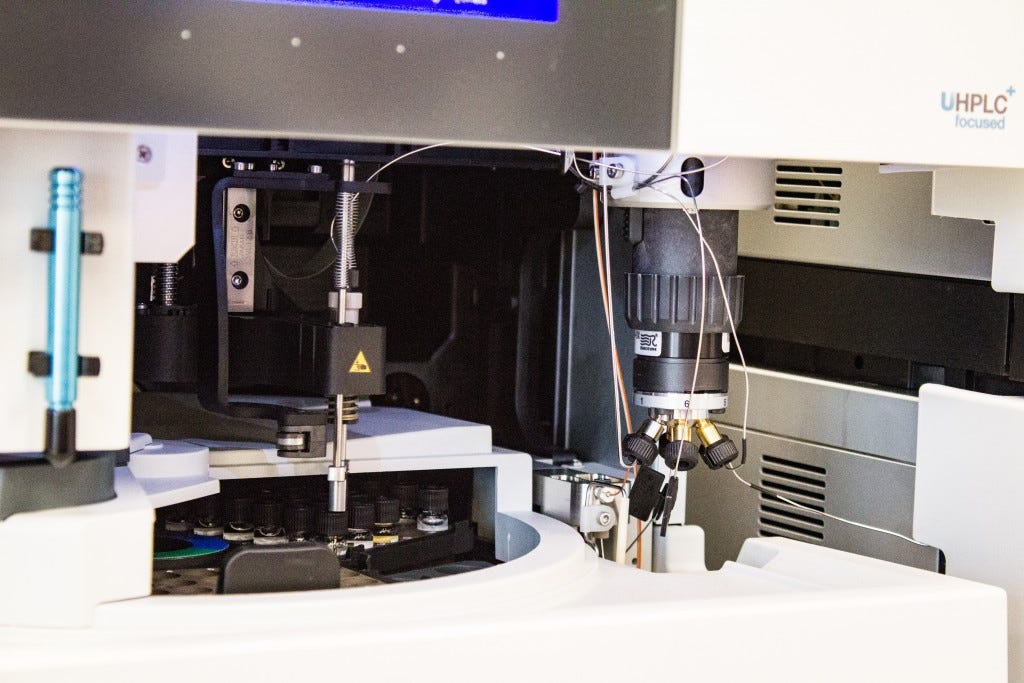
HPLC auto-sampler pulls samples from tiny vials and injects the sample into a high-pressure column for analysis
Abstract:
This report focused on the determination of the caffeine in coffee brewed at home, as analyzed by high performance liquid chromatography and calibrated against a known caffeine standard calibration curve. The coffee was determined to be 45.37 ppm, with a standard deviation of 2.493 and an RSD of 5.49 %, the ppm in an average cup of Cedar’s coffee (approx. 250 mL) would be 499.7 ppm, lower than the estimated 800 ppm from literature values.
Purpose:
The purpose of this experiment is to demonstrate the high performance liquid chromatography advantages by determination of caffeine concentration in beverages.
The instrument used will be the ThermoScientific UltiMate 3000 HPLC by Dionex and using the Chromeleon software system. Prior to analysis, the instructor set up the system to select the sequence: CHM 364 Caffeine Analysis.
Method Parameters:
Column Acclaim 120 C-18; 150 mm X3 mm: 3 micron particles Flow Rate 0.3 mL/min Eluent Composition 50% methanol/50% HPLC grade water Detector UV/Vis Detector Lambda 270 nm Run Time 5:00 minutes Sample Size 10.0 microliters Flow Profile Isocratic
Procedure:
Calibration Curve
Prepared a 510.9 ppm solution of caffeine in water using a 1 L volumetric flask.
Weighed out dry caffeine, as below:
Empty Boat (g) Boat and sample (g) Dirty Boat (g) Actual dry weight (g) 0.6278 1.1403 0.6294 0.5109
Table I
Placed the dry caffeine in a clean, empty 1 L volumetric flask. Added a small amount of DI water, then placed the flask in the sonicator until the caffeine was fully dissolved. Removed the flask to the bench, then placed more water, filling 2/3 of the bulb of the flask, then swirled to combine the higher concentration with the lower, watched to determine that the wavy lines of higher concertation had disappeared.
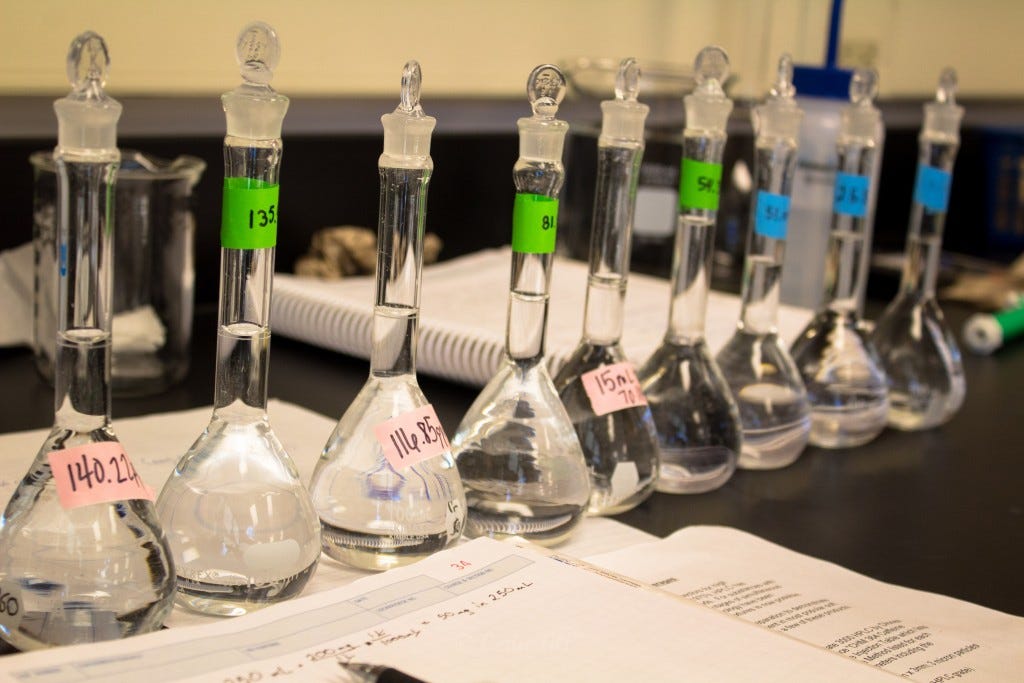
From this stock solution, prepared three standards, while the others in the group prepared three each, per instructor’s guidelines. The standards were to range from 0-150 ppm. Small amounts of the stock solution were pipetted into 100 mL volumetric flasks, then diluted to mark with DI water.
Amount measured from stock (mL) Dilute solution concentration (ppm) 1.00 5.109 10.00 51.09 5.00 25.55
Table II
The standards were filtered into 2 mL sample vials for injection. A small portion of the standard solutions, about 5-10 mL, was drawn up into a plastic 10 mL syringe. A 0.20 µm disposable filter was used. The first 2 mL of filtrate was discarded, the next 2 mL was put into the vial, and the remaining liquid was discarded.
Working from the highest concentration to the lowest and using the rinsing technique of forcing the first 2 mL through the filter, then discarding it, the nine standard solutions were filtered into vials, then labeled, capped, and placed into the sample rack. Working with the instructor, entry of the vial’s names and location in the Sample Table in Chromeleon for analysis was completed.
Before the beverages containing caffeine could be analyzed, they had to be degassed and filtered to prevent damage to the machine and the introduction of gas bubbles which would affect analysis. Prior to the samples being filtered, a rough determination of the amount of caffeine was made and a dilution was made accordingly.
In the case of the coffee brought from home, the caffeine would have been about 200mg per 250 mL, or 800 ppm. Thus, a dilution ws made by pipetting 5.00 mL coffee, 25.00 mL methanol, and 25.00 mL HPLC grade water. It was expected that this concentration would be within range of the standards made up for the HPLC. This was then filtered and three vials made up from the coffee dilution.
The soda (Dr Pepper) was estimated to not need dilution and was filtered into vials. All sample vials were labeled and entered into the system as they were inserted into the sample rack and analysis began.
The autosampler withdrew injections from the vial, and the first samples were the standard solution to determine the retention time. The area response characteristics were also observed to recognize the determination of caffeine in HPLC.
Sample Identifier Concentration (ppm) Area (mAUxmin) Retention Time A1 5.109 7.549 2.430 A2 25.55 41.535 2.427 A3 51.09 76.503 2.430 A4 54.37 83.616 2.430 A5 70.11 105.096 2.430 A6 81.56 122.952 2.430 B1 116.85 172.479 2.433 B2 135.90 203.492 2.430 B3 140.22 211.866 2.433 B4 0 0.233 1.990
Table III
Calculations:
Using the equation of the line produced by the calibration of the standards, the unknown concentration of the coffee samples was determined, as shown in Table IV.
X= 48.2174
Cedar Concentration (ppm) Area A 48.22 72.924 B 43.58 66.009 C 44.32 67.121
Table IV
Discussion of Results:
The line for the calibration curve came out very accurate, with a value of three nines (R² = 0.9996), good to see when three people were making the standards up. The determination of the caffeine in the coffee was thus considered to be accurate at 45.37 ppm, with a standard deviation of 2.493 and an RSD of 5.49 %. Looking at the dilution, from 5.00 mL to 55.00 ml, then the ppm in an average cup of Cedar’s coffee would be 499.7 ppm, lower than the estimated 800 ppm from literature values.

Caffeine standards in 100 mL volumetric flasks.


