Laboratory Instruments
I'm writing up a presentation which is intended to introduce and give an overview on the instruments we use in the analytical chemistry laboratory. What I've done is include the text below (the completed project is actually in poster format). If you see anything that doesn't make sense, could you let me know in comments? I have until Friday morning to make changes. Thanks! ETWYRT will appear tomorrow, as scheduled.
Spectroscopy
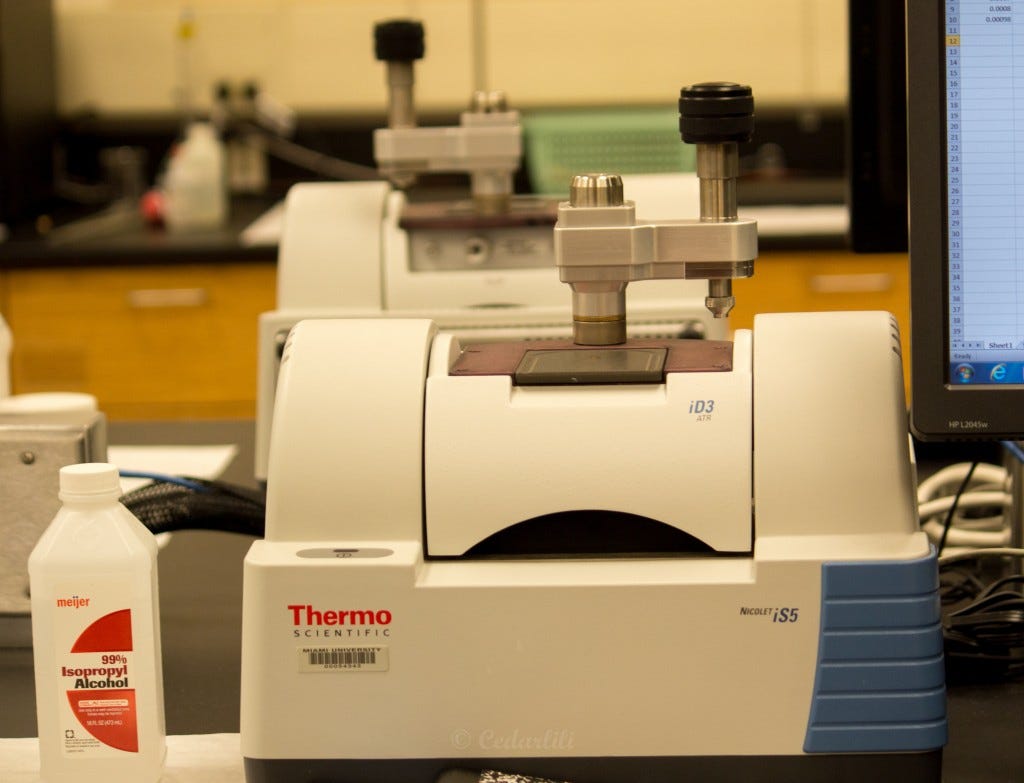
IR, crystal for sample is flat surface at top, swing-arm comes over and presses down to exclude air.
Infrared (IR) Spectrometer
This instrument detects vibrational energy translation. It can analyze liquids and solids. A beam of infrared lights is passed through a sample, and the infrared spectrum of the sample is detected. If the vibrational frequency of a sample is the same as the infrared energy, the energy is absorbed. So the instrument detects a lessening of energy after passage through a sample.
Infrared spectrometry is useful in organic and inorganic chemistry to analyze samples. This instrument is an improvement on older models which required salt cells to contain the sample, as with the attenuated total reflectance the sample may be pressed against the crystal and a reading taken. This is a faster method and easier to conduct for students
UV/Vis Spectrophotometer
UV/Vis Spectrophotometer
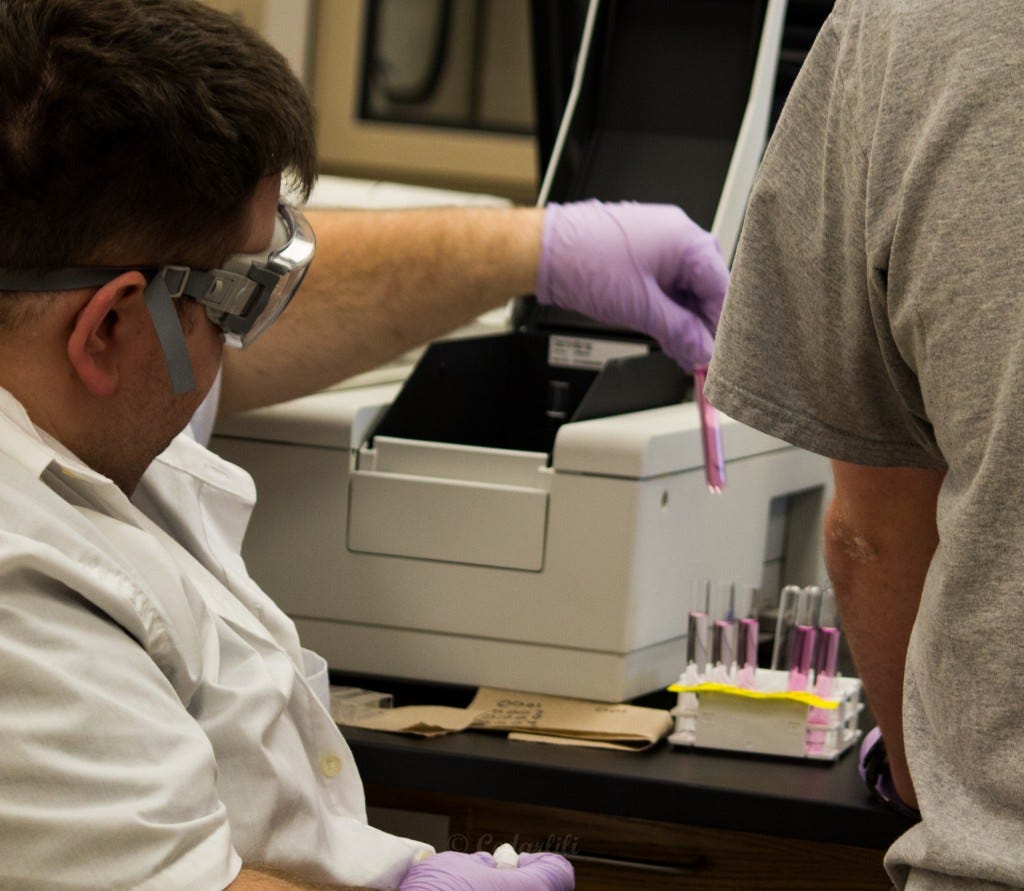
This instrument uses light in light in the ultraviolet and visible region to analyze molecular compounds and complex ions. It can be used to conduct qualitative analysis, through comparison absorption or transmission spectra to known spectra, or quantitative analysis by the use of Beer’s Law.
Samples are contained in cuvettes, and an intense light source is directed through the sample. To properly detect the absorption, the wavelengths must be controlled through the use of an absorption filters or a monochromator. The detector of the resulting emissions or light remaining after absorption is a photomultiplier tube or photodiode, which amplifies the light emitting from the sample compartment.
When the instrument is operating in the visible spectrum, then glass or plastic cuvettes may be used, but they do not allow ultraviolet light passage. For UV analysis, special quartz cuvettes must be used. Sample preparation to avoid interferences is important, as is the concentration of the sample being tested: too high or too low and the transmittance will deviate from Beer’s Law.
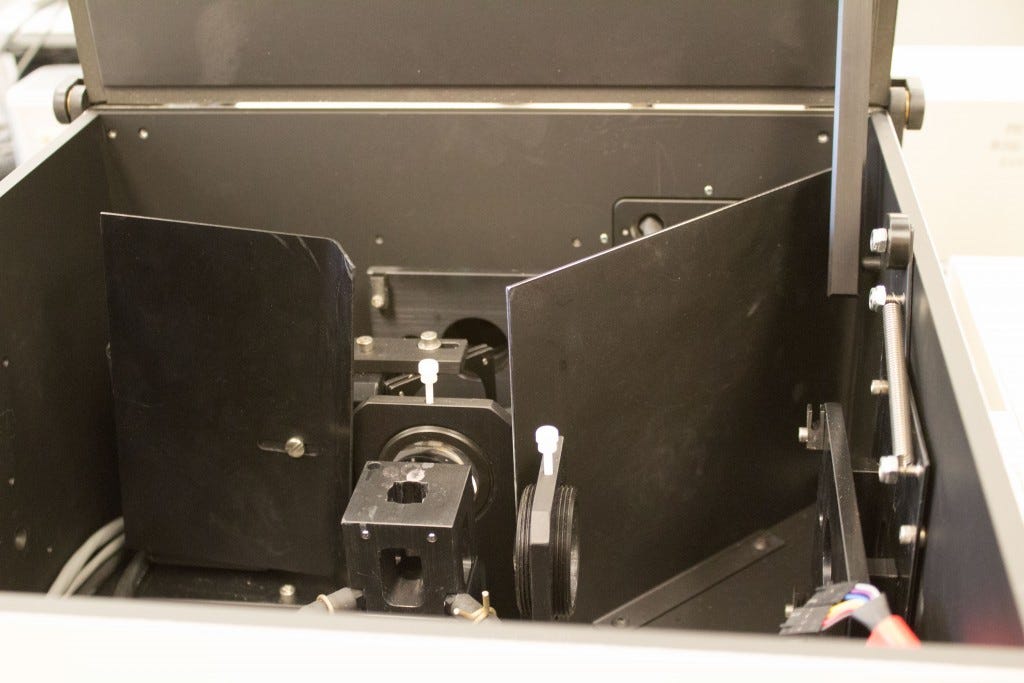
Fluorometer showing baffles and right-angle detector
Fluorometer
The fluorometer detects the emission of light from a chemical species following the excitation of that species by an intense energy source. Some substances, when bombarded with energy, will emit energy of a lower wavelength after exposure to an irradiating light, in a process called luminescence. Light that is emitted by a direct return to the ground state after excitation is called fluorescence, while light that is emitted after routing through other energy states, thus causing a delayed reaction, is called phosphorescence.
The fluorometer detects the intensity of the light emitted after excitation, but the source light would damage the detector, so it is isolated by baffled from the beam and set at right angles to the source. The sample solution is in a cuvette which allows the emitted light to pass through freely.
Fluorometry and absorption spectrophotometry have similarities in that they are able to analyze many molecular species and complex ions. While the number of species that will fluoresce is few in number, the process is less prone to have interferences than absorption spectrophotometry does, and is therefore a more sensitive process.
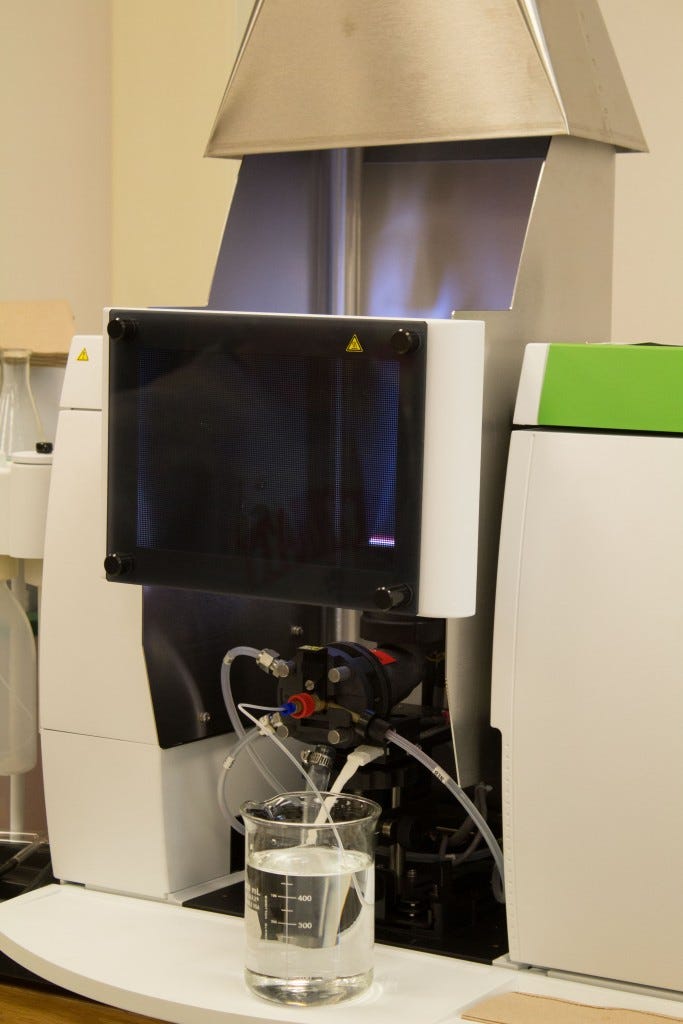
Atomic Absorption flame on!
AAS
The Atomic Absorption Spectrometer uses a flame atomizer, and can detect absorption of energy by an atomic species, or less commonly, the emission created by an excited species. In this instrument, a small sample is drawn into the flame, where it is atomized and the absorption of a light source shone through the flame to a detector on the other side is analyzed. The AAS is used for the analysis of metal atoms.
The lamp used to emit the light source for the absorption analysis is specialized, and emits only the specific wavelength of the species to be tested. The use of the hollow cathode lamp to emit the desired spectral line sources eliminates the need for a monochomator or other filter before the flame. When the flame is used to analyze emission, no source of other light is needed, but a monochromator between the flame and the detector reduces the light interference given off by the flame itself.
The flame is controlled by design of the burner head to be narrower as needed, and by use of different oxidants that allow the temperature of the flame to be elevated enough to atomize metal ions. The absorption and emission spectra that are produced through this process are sufficiently sharp and clear to be used as identification of specific species rather than simple classifications.
Chromatography
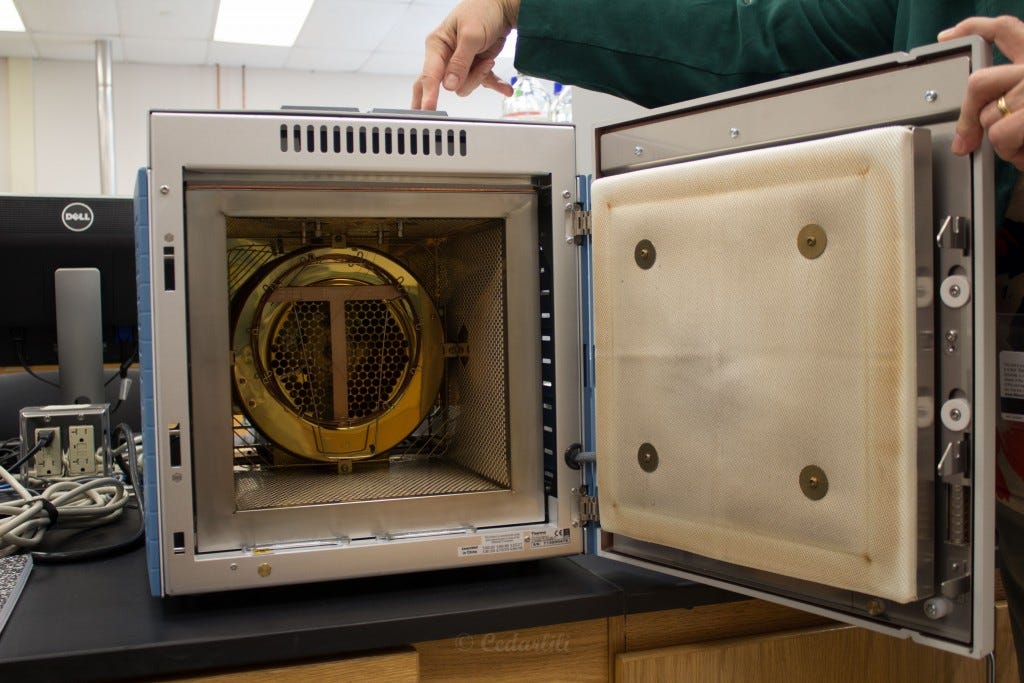
Gas Chromatograph oven
GC
The Gas Chromatograph uses separation science to produce an analyte species that is then detected with spectrometry. In gas chromatography the mobile phase is gas, while the stationary phase is a coating on the inside of a very narrow inner diameter tube called a column. As the mixture components emerge from the column, they are detected and electronic signals that are produced create a chromatogram. The chromatogram, then, is a visual of the separation of the species in the mixture being analyzed, and this is read in terms of retention time (or how long an element takes to move through the column) and the area of the peak shown while the detector registers that component emerging.
While that is the same for both liquid chromatography and gas chromatography, the GC requires that the samples be heated upon injection in order to vaporize them into the carrier gas which will then pass through the column. The column is in an oven, with the temperature control separate from the injector and the detector, each a vital part of the process.
The column in the GC is very long, ranging from 2-300 ft. The temperature control keep the analyte from condensing during the separation process. As the columns are also very small inside, the volume of the sample injected must be carefully controlled or the column may be overwhelmed. Finally, the range of detectors available at the end of the process allows for diverse qualitative or quantitative analysis of many compounds.
GC/MS
The Gas Chromatograph/ Mass Spectrometer takes the analysis offered by the chromatogram of the gas chromatograph a step further. The elements of the compound that have been separated by the column are made into ions, information about their mass is gathered, and an electronic signal for each ion generated. The mass spectrum is a series of sharp peaks, one for each ion generated, and is plotted on a signal versus mass-to-charge ration. The magnitude of the peaks is proportional to the number of ions present in the analyte. Although the process is called spectrometry, light is not used in the detection process.
Qualitative analysis can then be conducted with this instrument because each mass spectrum is unique to the analyte, like a fingerprint. Quantitative analysis is possible due to the signal intensity indicating how many ions are present in the analyte, with the intensity of the signal being proportional to the concentration.
A mass spectrometer consists of a sample inlet, an ion source, the mass analyzer, the ion detector, and a vacuum system. The vacuum ensures that the system is operated under very low pressure, eliminating air that could interfere with analysis. Air is not the only possible contaminant, the analyte must be 100% pure when entering the ion source. The Gas chromatography part of this system is the inlet source to the mass spectrometer, allowing better resolution of complex mixtures.
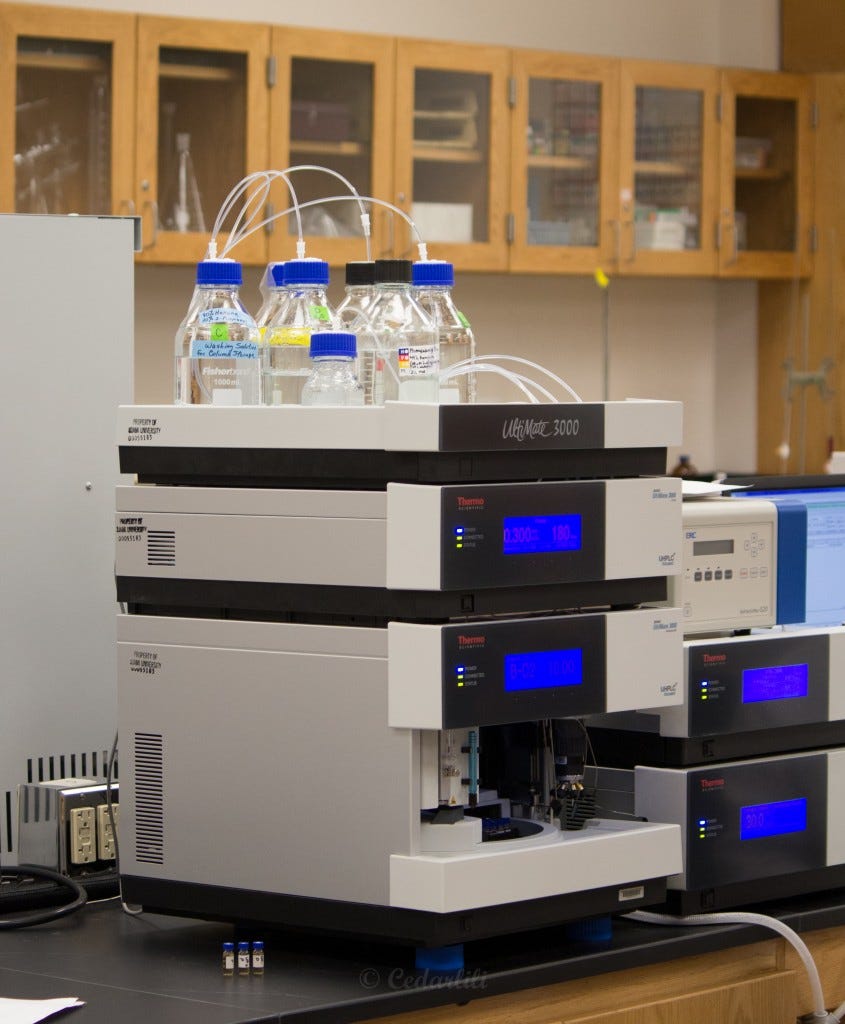
The HPLC
HPLC
High Performance Liquid Chromatography also uses separation in a column to analyze parts of a mixture, but the mobile phase is a liquid, and the column is much shorter and wider than that of the GC. The column in this instrument is packed full of a stationary phase which the mobile phase will make its way through, and depending on the polarity and other factors of the phases, some elements will emerge at the end sooner than other elements, creating the characteristic separation this process relies on.
As with the GC, the HPLC yields an electronic chromatogram at the end of the column as elements pass by a detector. The popularity of the high performance machine is the speed at which this analysis can be done, with results in minutes rather than hours or even days using older methods. Using technology and gradient elutions, complex analyses can be performed with relative simplicity.
The HPLC instrument contains several components, from the solvent reservoir jars seen on top of the machine, which are then pumped into the unit below them, before the solvent sweeps up the analyte solution as it is auto-injected by the machine and enters the column. Above the column found in the bottom of the second tower is the detector and computer which then processes the data fed to it by the detector.
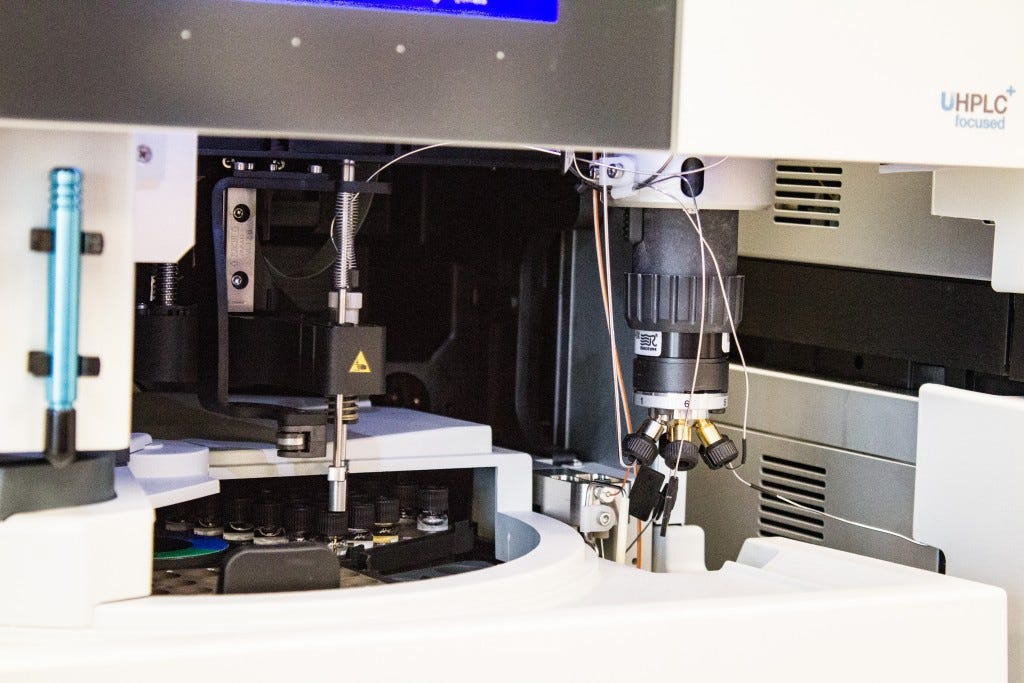
Auto-injector for HPLC
Sources: Kenkel, Analytical Chemistry for Technicians, CRC Press, 2014


